Skip to content

About the BFiab module 

Benefits of the BFiab module

icon_check_blue_2023.png

Easy to use, with 
customizable information

icon_albizia_blue_2023.png

Efficient, accurate
 calculations (ALBIZIA)

icon_like_blue_2023.png

Compatible
with the other
Boolean package modules

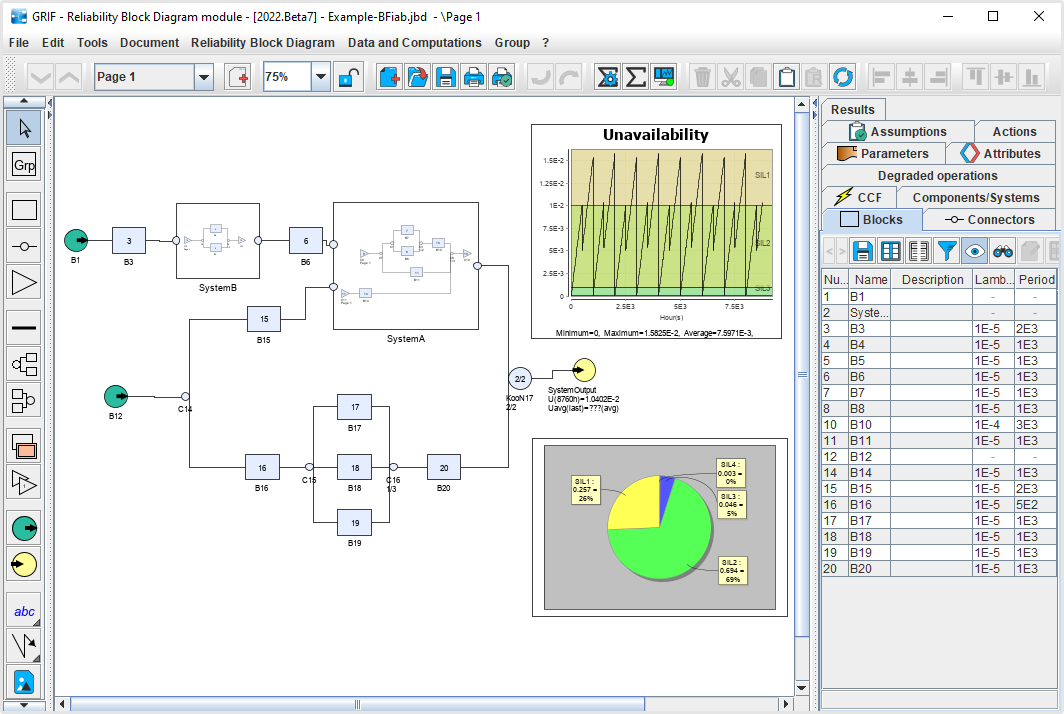
  • Creating RBDs is easy using the intuitive graphical interface via which connectors (series, in parallel, K over N) and blocks can be entered according to the logic of the system being assessed and a number of probability distributions (Exponential, Weibull, Gamma, Lambda, Mu, Periodic Test, etc.).
  • If there is no distribution function, you can specify your own probability distribution using either a value table or a Markov chain.
  • Once the block diagram has been built, groups of components subject to common cause failures can easily be defined using different CCF models (Beta Factor, GLM, Shock models).
  • With the “Attribute” feature (system with custom properties), you can add any information you require to each object in the document, either to provide a more detailed description or for traceability purposes.
     

bfiad.png

ALBIZIA, the computation engine developed by TotalEnergies, obtains a large number of results:

  • Unavailability: Q(t), U(t) or PFD(t), Availability : A(t), Reliability: R(t), Unreliability: F(t).
  • Frequency: W(t), UFI(t) or PFH(t); and Failure rate: λeq(t), λv(t) or CFI(t).
  • Usual mean values: MTTF, MTBF, MUT, MDT, number of failures.
  • Minimal cut-sets (probability and frequency of cut-sets).
  • Reliability allocation.
  • Many importance factors (Birnbaum MIF, Critical CIF, Vesely, DIF…) that will help users to find system weaknesses and improve on them.

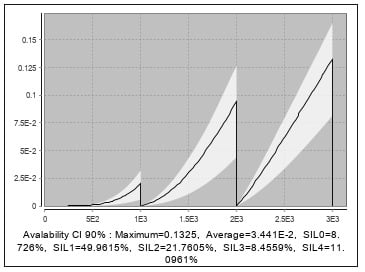
Calculating the time spent in SIL zones:  in addition to the calculations defined above, ALBIZIA is the only engine that can calculate how long the PFD(t), PFH(t) or EqLambda(t) of a system spends in the various intervals during its operation.

The figure below shows a mean availability of 8.44E-3, which corresponds to SIL2. However, it also indicates the percentage of time the system spent in each SIL over its 30 years’ operation. In this case, it spent 39.77% of the time in SIL1.

graphic_2_12023.jpg

Factoring in uncertainties:

  • To simulate real-life conditions as closely as possible (and ensure compliance with certain standards), parameter-related uncertainties can be factored in. For example, a failure rate can be qualified as following a Uniform, Normal or Log-Normal distribution.
  • A Monte-Carlo simulation is performed in addition to the BDD calculation to obtain mean values.
  • Finally, a quantile calculation is performed to provide a confidence interval for each result. The interval can be 60, 70, 80, 85, 90, 95 or 99% (centered or not). N.B. in accordance with IEC standard 61511.

bfiab_groupes_sous_systemes.jpg

User-friendly design

  • With the automatic layout function, users can efficiently organize their RBDs simply by pressing F7.
  • Blocks can be quickly duplicated using the copy/paste function. A specific image can be assigned to each block to make the diagram clearer to read.
  • You can also add comments and line graphs to create your report directly from the PDF printout.

bfiad_compatibilite.jpg

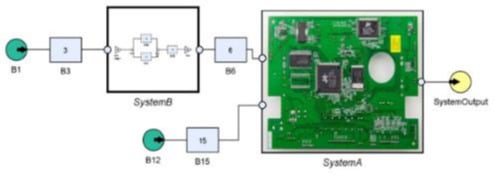
Groups and sub-systems: The BFiab module not only helps you organize your diagram and make it easier to print, it can also be used to create sub-systems. This notion of hierarchy means that the model can be divided up according to the actual distribution of the system whatever the number of inputs/outputs. A preview is displayed on the block so that its composition is always visible.

All the RBDs produced can be integrated into the Bool module which combines the characteristics of all the modules in this package.


  • • Calculations can be performed in the same document using Event Trees (ETree), Fault Trees (Tree), Reliability Block Diagrams (BFiab), Safety Instrumented Systems (SIL), Reliability Network (Reseda), or Bow-Tie / LOPA tables (Risk).
  • • Models can be linked together, and a link can define any object (Event, Block, Barrier, Network node, etc.) using any model: Fault Trees, Block Diagrams, SIS, Event Trees; etc.

Users in different departments of a company can work on their respective models and link them together. For example, a system engineer defines a system with 30 items of equipment using a block diagram, and the reliability engineers then create a fault tree for each item of equipment. Each fault tree is then linked to its block and the system engineer can calculate the system availability or reliability without seeing the fault tree.

  • Option to automate calculations (batch runs) and draw variations for sensitivity analysis.
  • Results are stored in the document and can be exported in a variety of formats (csv, XML, Excel, etc.).
  • Results can be viewed as line graphs, pie charts or histograms.
  • Printing in PDF vector format produces high-quality images and the files are small enough to be sent by email, even if the document contains hundreds of pages.
  • Interaction with the operating system: option to copy/paste either to or from word processing software, spreadsheets, or presentation tools.
  • Models can be exported into the Tree module.
  • Models can be exported into the BStoK module to take into account integrated logistics support.
  • External files (PDF certificates, system images, etc.) can be added to the document and incorporated into the full report.
Sectors of activity: aeronautics, aerospace, energies, defense, telecoms, transportation, health, universities and research

GRIF is designed for any field of activity

Whether for an oil platform, aircraft, train or water supply system, GRIF evaluates the reliability and availability of any system using a range of computational techniques. The GRIF software suite offers a wide variety of calculation methods so that users can select the most appropriate (analytical, simulation, etc.), according to the system being modeled.

Need more information? 

About the Boolean package 

About GRIF